Hey guys, today I am going to post this quick webinar with some QA metrics to use in your project.

Really simple and good presentation about percentages of integration/code coverage and other metrics.
Hey guys, today I am going to post this quick webinar with some QA metrics to use in your project.
Really simple and good presentation about percentages of integration/code coverage and other metrics.

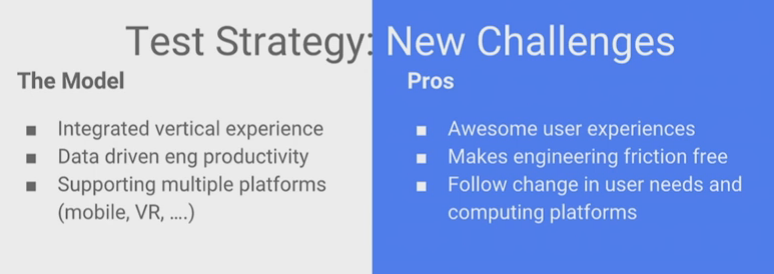
As any other model, this doesn’t say this should fit to every company, but this is the typical idea and what Google follows. You can follow this, but you need to be aware that maybe this is not the best model for your company.
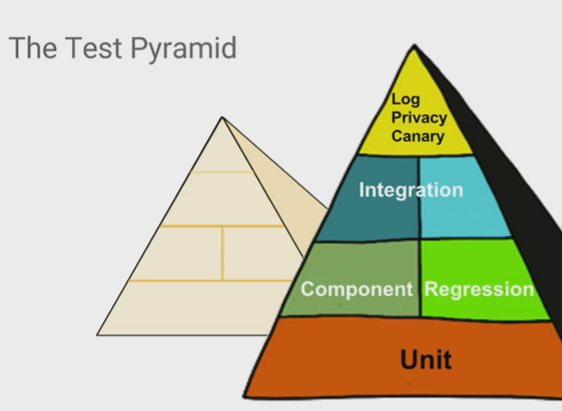
This pyramid shows how much of each type of tests you should focus more. So, in numbers this should be:
The top of the pyramid is about test the logs, this is not really a common test, but it is about making sure the behaviour is correct, testing the logs according to the action, the base of your system. For example, Google saves all the data from the users in the logs and keep all these information making sure the data is protected. From bottom to top each stage of test requires high level of domain knowledge, high amount of setup costs, investment, time, machine resources.
The canary tests approach is about pushing the release to a first batch of end users, who are unaware that they are receiving this new code. Because the canary is only distributed to a small number of users, if your company is global remember to have this small group of end users divided per each location, its impact is relatively small and changes can be reversed quickly should the new code prove to be buggy.
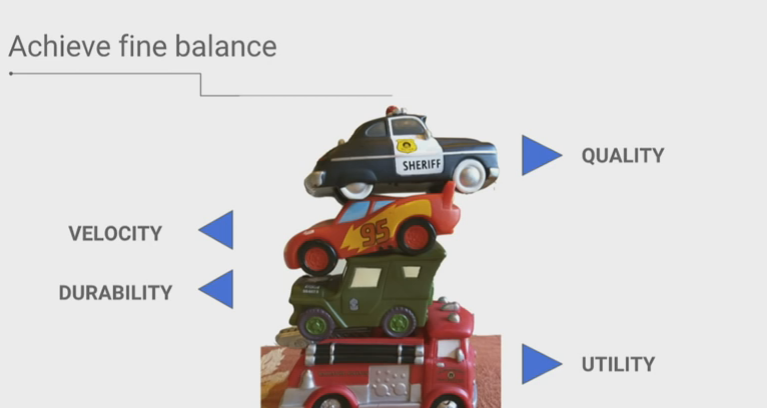
You need to consider all these aspects to build robust automation frameworks that have a utility and usability through the time. You need to consider the velocity of your tests and of course the quality that you can achieve with small and frequently releases, keep in mind they need to work together.


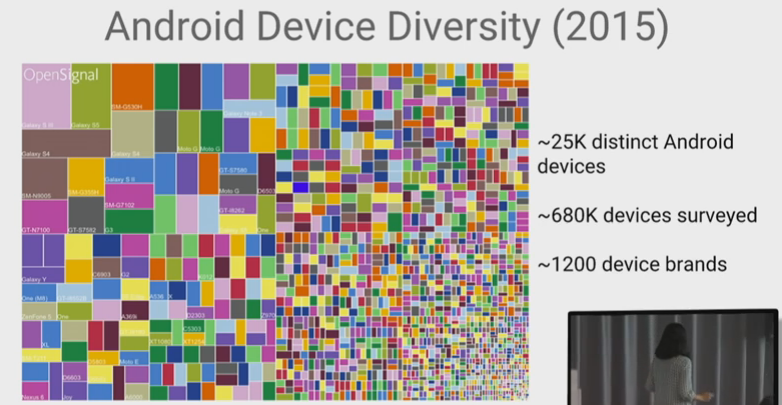
Google has grown on maturated taking into account different devices, platforms, features.
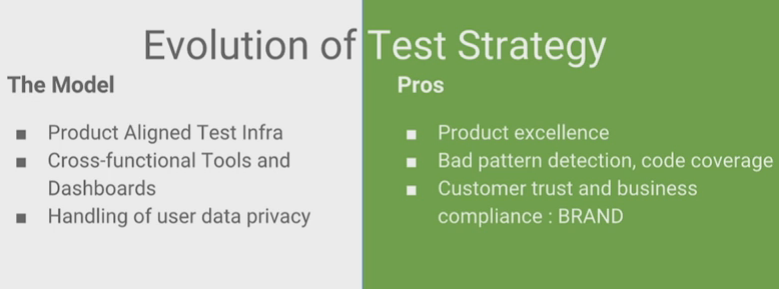

Take care of feature duplication. When a company grows, the number of tests with different goals grow together, but duplicating the same code. This leads to dead code and codes doing the same thing.
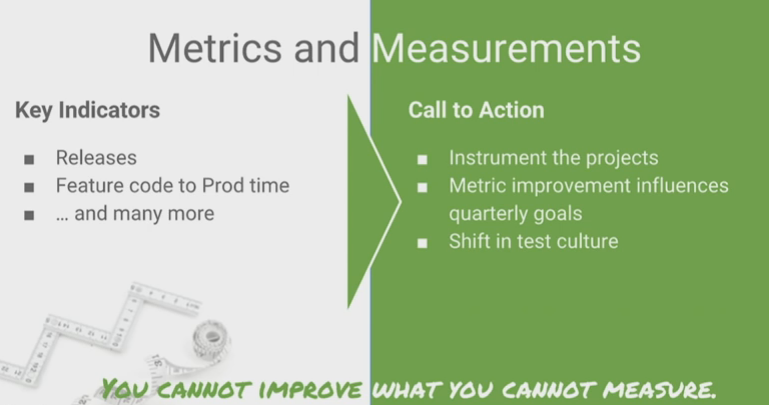
You can create metrics about defect leakage of your automation, how long is taking to run the tests, everything will help you to know where you can improve. So, try as much as possible to have clear objectives.

This is the test and release model that Google has at the moment, with some canary testing, monitoring step, frequent releases and feedbacks.
Most of the challenges that were said are the challenges of always, as a company you need to think constantly in growing and hire more people in different teams to work together, also every year we have hundreds of new devices to test and make sure your system is supported.
The complete video is here: https://www.youtube.com/watch?v=2yN53k9jz3U
Hey guys, today I am going to post some metrics for the automation projects. So, let’s start with the percentage automatable, which means how many test cases you can automate and how many you need to test manually.
PA (%) = ATC/TC
PA = Percent automatable
ATC = Number of test cases automatable
TC = Total number of test cases
As part of an AST effort, the project is either basing its automation on existing manual test procedures, or starting a new automation effort from scratch, some combination, or even just maintaining an AST effort. Whatever the case, a percent automatable metric or the automation index can be determined.
AP (%) = AA/ATC
AP = Automation progress
AA = Number of test cases automated
ATC = Number of test cases automatable
Automation progress refers to the number of tests that have been automated as a percentage of all automatable test cases. Basically, how well are you doing against the goal of automated testing? The ultimate goal is to automate 100% of the “automatable” test cases. It is useful to track this metric during the various stages of automated testing development.
TP = TC/T
TP = Test progress
TC = Number of test cases executed
T = Total number of test cases

A common metric closely associated with the progress of automation, yet not exclusive to automation, is test progress. Test progress can simply be defined as the number of test cases (manual and automated) executed over time.
PTC (%) = AC/C
PTC = Percent of automated test coverage
AC = Automation coverage
C = Total coverage (i.e., requirements, units/components, or code coverage)
This metric determines what percentage of test coverage the automated testing is actually achieving. Various degrees of test coverage can be achieved, depending on the project and defined goals. Together with manual test coverage, this metric measures the completeness of the test coverage and can measure how much automation is being executed relative to the total number of tests. Percent of automated test coverage does not indicate anything about the effectiveness of the testing taking place; it is a metric that measures its dimension.
DD = D/SS
DD = Defect density
D = Number of known defects
SS = Size of software entity
Defect density is another well-known metric that can be used for determining an area to automate. If a component requires a lot of retesting because the defect density is very high, it might lend itself perfectly to automated testing. Defect density is a measure of the total known defects divided by the size of the software entity being measured. For example, if there is a high defect density in a specific functionality, it is important to conduct a causal analysis. Is this functionality very complex, and therefore is it to be expected that the defect density would be high? Is there a problem with the design or implementation of the functionality? Were the wrong (or not enough) resources assigned to the functionality, because an inaccurate risk had been assigned to it and the complexity was not understood?
DTA = D/TPE
DTA = Defect trend analysis
D = Number of known defects
TPE = Number of test procedures executed over time
Another useful testing metric in general is defect trend analysis.
DRE (%) = DT/DT+DA
DRE = Defect removal efficiency
DT = Number of defects found during testing
DA = Number of defects found after delivery
DRE is used to determine the effectiveness of defect removal efforts. It is also an indirect measurement of product quality. The higher the percentage, the greater the potential positive impact on the quality of the product. This is because it represents the timely identification and removal of defects at any particular phase.
References:
